Shopify Reporting Tool for Non-Developers – Making Data Simple, Smart, and Actionable
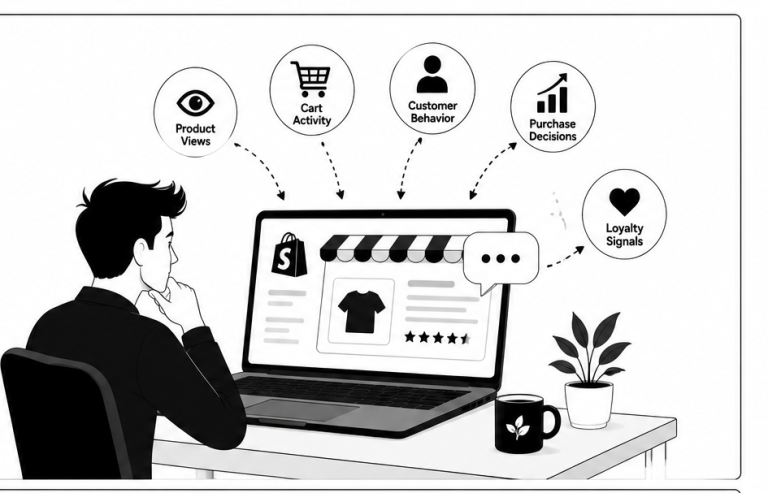
Running an online store is no longer just about adding products and waiting for orders. Today, success depends on how well you understand your store’s data—what customers are doing, which products are performing, and where your growth opportunities lie.
But here’s the problem: many store owners, marketers, and business teams are not developers. They don’t write code, they don’t work with complex systems, and they don’t want to spend hours trying to understand technical dashboards.
That’s exactly why Shopify reporting tools designed for non-developers are becoming essential.
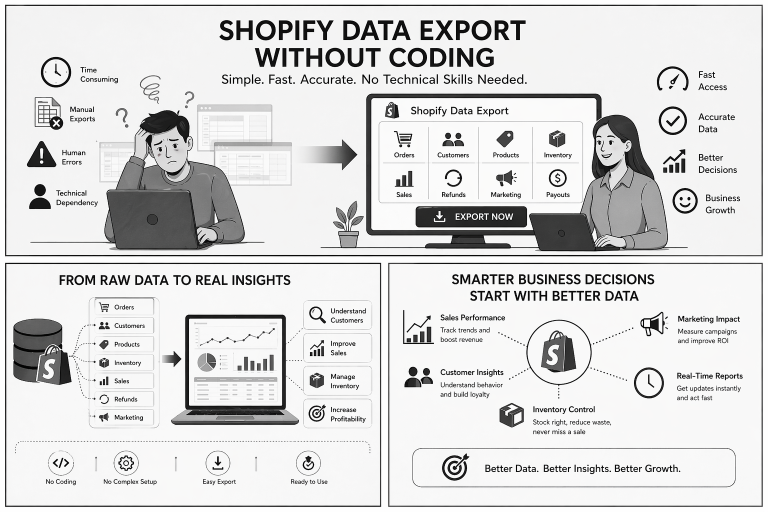
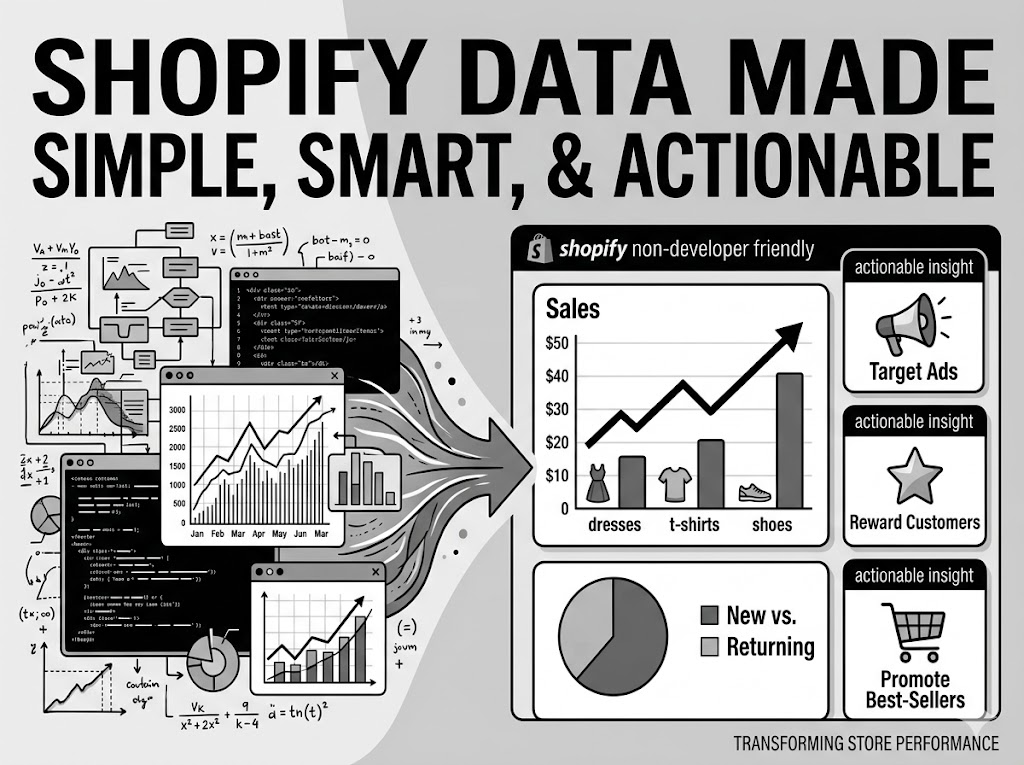
These tools simplify complex store data into easy, visual, and actionable insights—so anyone can understand and use it without technical skills.
Let’s explore how this works and why it can completely transform your business.
The Challenge: Data Without Understanding
Every Shopify store generates a huge amount of data daily:
- Orders being placed
- Customers browsing and buying
- Products being viewed and sold
- Traffic coming from different sources
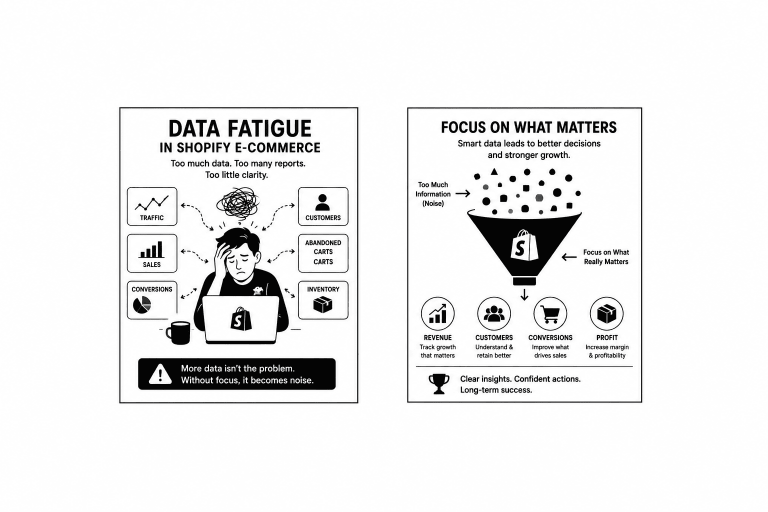
But raw data alone is not helpful.
For many non-developers, the challenges are:
- Data feels overwhelming
- Reports are hard to interpret
- Important insights are hidden
- Decisions become guesswork
As a result, businesses often miss opportunities—even when the data is right in front of them.
The Solution: Simplified Reporting for Everyone
A reporting system designed for non-developers focuses on one goal:
Make data easy to understand and easy to use.
Instead of technical complexity, it offers:
- Clean dashboards
- Visual charts and graphs
- Simple filters and search options
- Clear summaries of performance
This allows anyone—whether a business owner, marketer, or manager—to access insights instantly.
What Makes It “Non-Developer Friendly”?
Not all reporting systems are easy to use. The ones built for non-developers focus on simplicity and usability.
Here’s what sets them apart:
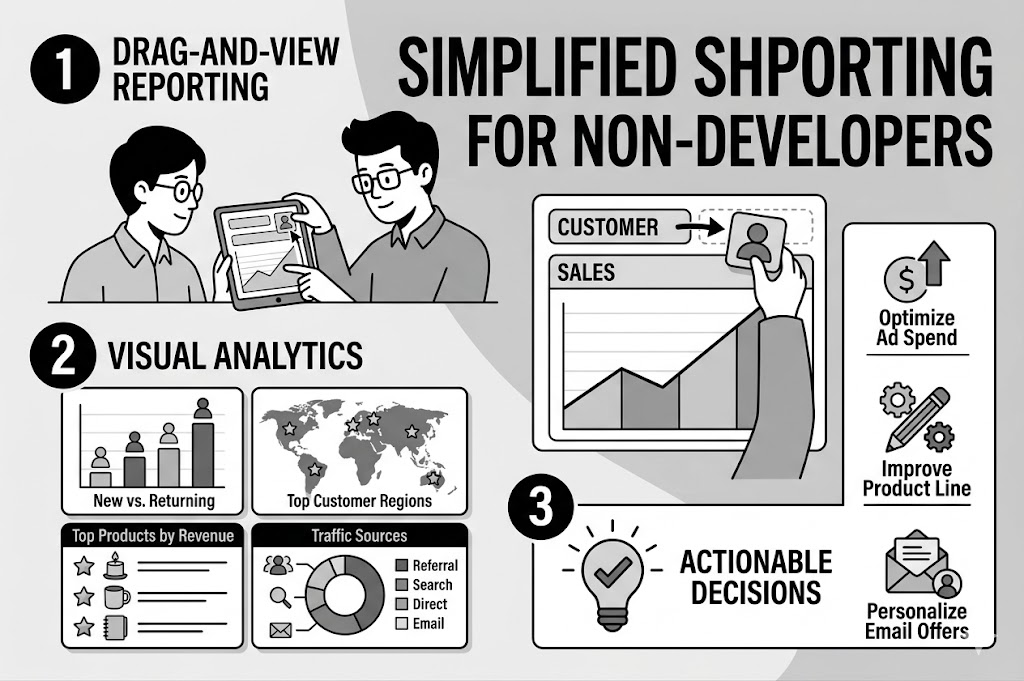
1. No Coding Required
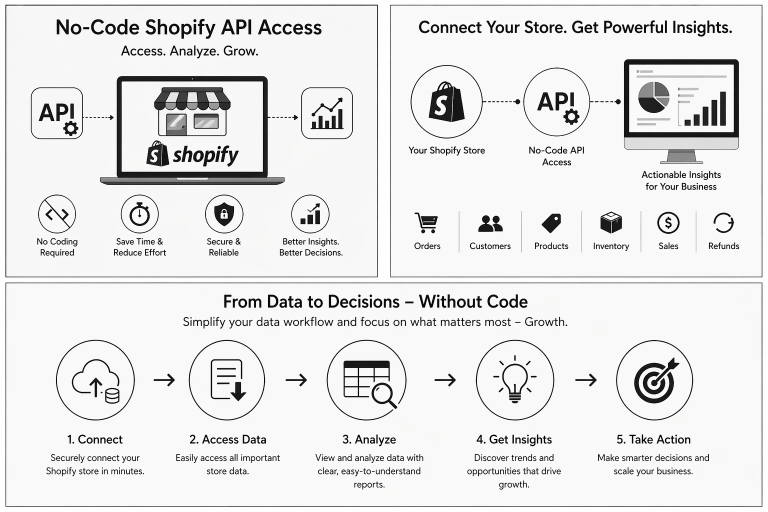
You don’t need to write queries or scripts. Everything works through clicks, selections, and visual controls.
2. Drag-and-View Interface
You can select what data you want to see and instantly generate reports.
3. Pre-Built Reports
Common reports are already available, such as:
- Sales performance
- Customer behavior
- Product analytics
4. Visual Representation
Instead of raw numbers, data is shown in:
- Graphs
- Charts
- Trends
This makes understanding faster and easier.
Key Data Areas You Can Access Easily
Even without technical skills, you can explore every important part of your store.
1. Orders and Sales Insights
You can quickly understand:
- Total sales over time
- Number of orders
- Average order value
- Refunds and cancellations
Why It Matters
Instead of just knowing your revenue, you understand patterns.
For example:
- Which days bring the most sales?
- Are discounts increasing order volume?
- Is your revenue growing consistently?
This helps you make smarter pricing and promotion decisions.
2. Customer Insights Made Simple
Customer data becomes easy to explore.
You can see:
- New vs returning customers
- Top customers by spending
- Purchase frequency
- Customer locations
Why It Matters
Not all customers behave the same way.
With these insights, you can:
- Reward loyal customers
- Target inactive customers
- Personalize marketing campaigns
This improves retention and builds stronger relationships.
3. Product Performance Without Complexity
You don’t need technical tools to understand which products are working.
You can track:
- Best-selling products
- Products with low sales
- Inventory levels
- Product-wise revenue
Why It Matters
This helps you:
- Focus on high-performing products
- Improve or remove weak ones
- Manage stock efficiently
It turns product decisions into data-driven actions.
4. Traffic and Behavior Insights
Understanding visitors is just as important as understanding buyers.
You can analyze:
- Where your traffic comes from
- Which pages users visit
- How long they stay
- Where they drop off
Why It Matters
This reveals:
- What attracts customers
- What confuses them
- Where you are losing potential sales
With this, you can improve your website experience.
The Power of Filters and Custom Views
One of the most useful features for non-developers is filtering.
You can easily:
- View sales for a specific date range
- Analyze customers from a particular location
- Check performance of a single product
This allows you to answer specific questions without complexity.
For example:
- “What were my top products last month?”
- “Which customers spent the most this week?”
With just a few clicks, you get clear answers.
Turning Insights into Action
Data becomes valuable only when you act on it.
Here’s how non-developers can use reporting insights effectively:
1. Improve Marketing Campaigns
By analyzing performance, you can:
- Focus on high-performing channels
- Stop wasting money on low-performing campaigns
- Target the right audience
2. Optimize Product Strategy
You can:
- Promote best-selling products
- Adjust pricing
- Bundle products together
3. Enhance Customer Experience
Insights help you:
- Simplify checkout process
- Improve product pages
- Offer personalized recommendations
4. Manage Inventory Smartly
You can:
- Restock popular products quickly
- Avoid overstocking slow-moving items
Real-Life Scenario
Imagine you run an online clothing store.
Without technical knowledge, you check your reporting dashboard and discover:
- Dresses are selling more than other categories
- Most customers are from a specific city
- Sales peak during weekends
Now you can:
- Focus marketing on dresses
- Target ads in that city
- Run weekend promotions
All of this is done without coding—just by understanding simple reports.
Benefits for Non-Developers
Using a reporting system designed for non-developers offers major advantages:
1. Confidence in Decision-Making
You no longer rely on guesswork.
2. Time Efficiency
No need to wait for technical support.
3. Better Collaboration
Teams can understand the same data easily.
4. Faster Growth
Quick insights lead to quick actions.
Common Mistakes to Avoid
Even with simple tools, some mistakes can reduce effectiveness:
1. Ignoring Data Regularly
Checking reports only occasionally limits insights.
2. Overlooking Key Metrics
Focusing only on sales and ignoring customer behavior.
3. Not Taking Action
Insights are useless without implementation.
4. Looking at Data in Isolation
Always connect orders, customers, and products together.
The Future: Even Simpler, Even Smarter
The future of reporting for non-developers is becoming more intelligent.
Soon, systems will:
- Highlight important insights automatically
- Suggest actions based on data
- Predict trends and opportunities
This means you won’t just see data—you’ll understand exactly what to do next.
Final Thoughts
Shopify reporting tools for non-developers are transforming how online businesses operate.
They remove technical barriers and make data accessible to everyone—whether you are a store owner, marketer, or business manager.
You don’t need coding skills to understand your business anymore.
All you need is the ability to read simple insights and take action.
Because in today’s e-commerce world, success doesn’t belong to the most technical—it belongs to those who can understand their data, act on it quickly, and continuously improve.