Shopify Data Reporting Tool – Turning Store Data into Smart Decisions
Running an online store is not just about listing products and waiting for sales. Behind every successful store lies a deep understanding of data—what customers are doing, which products are performing, and where opportunities are being missed.
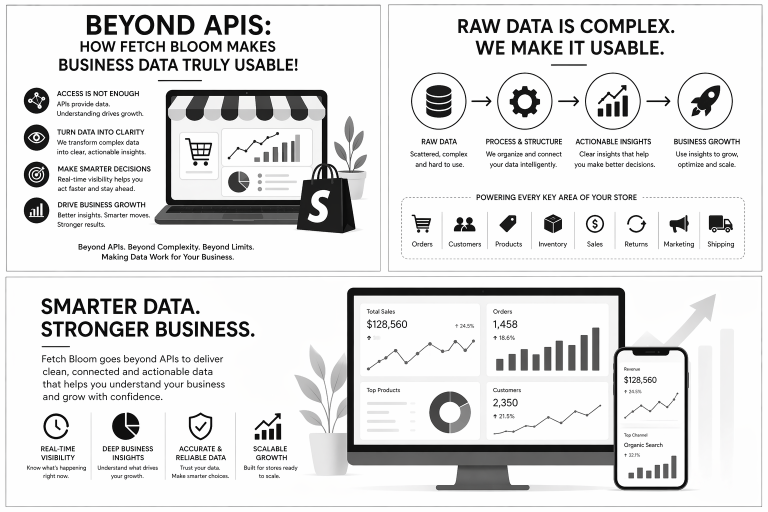
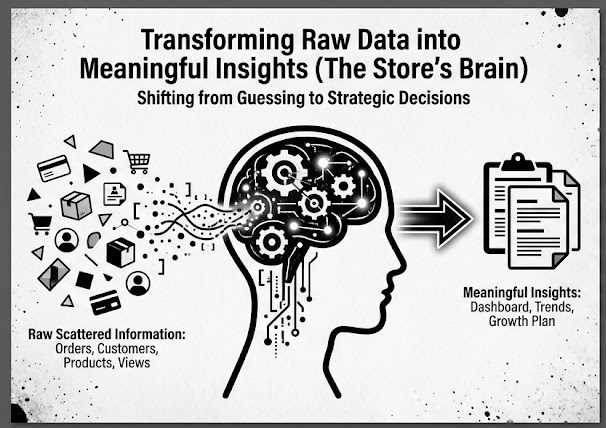
Many store owners collect data every day but fail to use it effectively. Orders come in, customers browse, products get views—but without proper reporting, all of this remains just scattered information. This is where a Shopify data reporting tool becomes essential.
It acts like the brain of your business, transforming raw numbers into meaningful insights that guide your decisions. Instead of guessing what works, you begin to know what works.
Let’s explore how this works and why it plays such a powerful role in e-commerce growth.
What is a Shopify Data Reporting Tool?
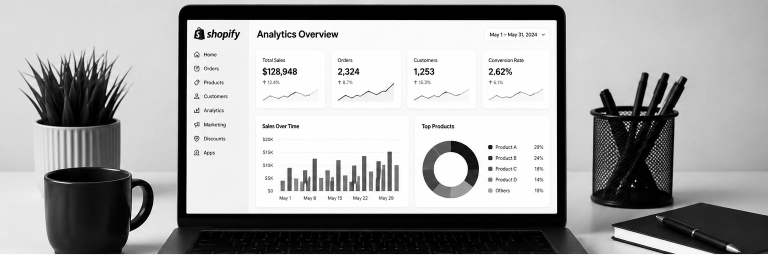
A Shopify data reporting tool is a system that collects, organizes, and presents your store data in a way that is easy to understand.
It pulls information from different areas of your store, such as:
- Orders
- Customers
- Products
- Sales performance
- Traffic behavior
Then, it converts this data into:
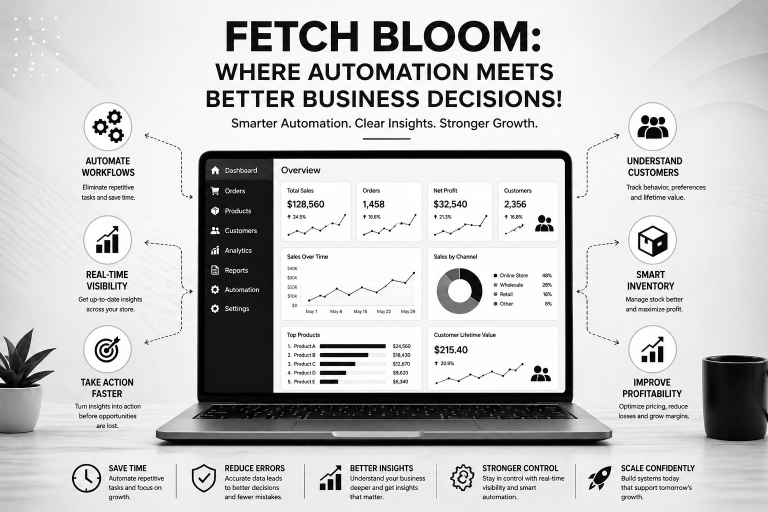
- Visual dashboards
- Charts and graphs
- Structured reports
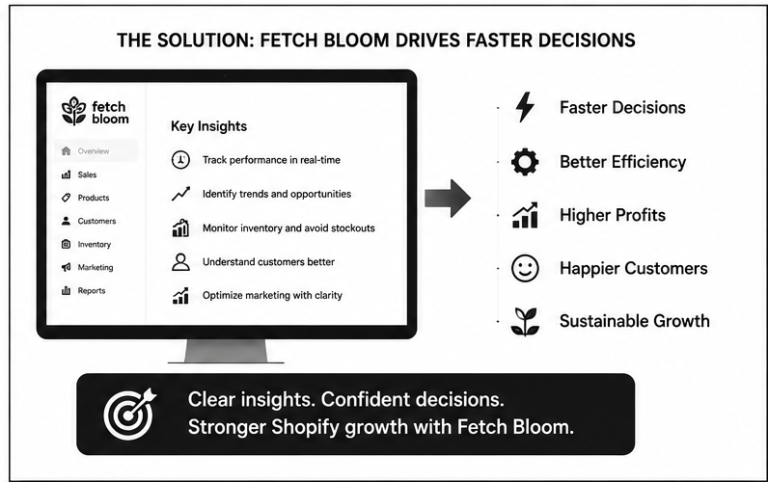
The goal is simple: help you make better decisions faster.
Why Data Reporting Matters in E-commerce
Without reporting, you are operating blindly.
You might know:
- You got 50 orders today
- A product sold well
- Traffic increased
But you don’t know:
- Why sales increased
- Which customers contributed the most
- What caused a drop in conversions
- Which products are truly profitable
A data reporting system answers these questions.
The Real Advantage
It shifts your business from:
- Guessing → Understanding
- Reacting → Planning
- Random actions → Strategic decisions
Key Areas Covered by Data Reporting
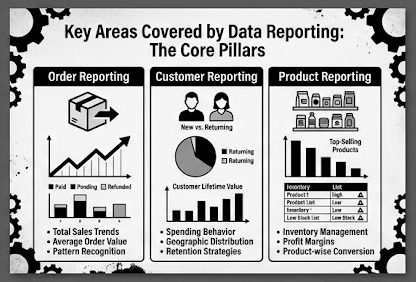
A strong reporting system focuses on three core pillars of your store.
1. Order Reporting
Orders are the most direct indicator of your store’s performance.
A reporting system helps you analyze:
- Total sales over time
- Daily, weekly, and monthly trends
- Average order value
- Payment status (paid, pending, refunded)
- Fulfillment and shipping performance
Why It Matters
Instead of just counting orders, you understand patterns.
For example:
- Are weekends stronger than weekdays?
- Are discounts increasing order volume?
- Are refunds affecting profit?
This helps you optimize pricing, offers, and operations.
2. Customer Reporting
Customers are not just buyers—they are the foundation of long-term growth.
A reporting system provides insights such as:
- Number of new vs returning customers
- Customer lifetime value
- Purchase frequency
- Geographic distribution
- Spending behavior
Why It Matters
Not all customers are equal.
Some buy once and never return. Others become loyal repeat buyers.
With proper reporting, you can:
- Identify high-value customers
- Create personalized offers
- Improve retention strategies
This leads to more stable and predictable revenue.
3. Product Reporting
Products determine your store’s success, but not all products perform equally.
Reporting helps you track:
- Best-selling products
- Low-performing items
- Inventory levels
- Profit margins
- Product-wise conversion rates
Why It Matters
Instead of guessing which products are “good,” you get clear answers.
For example:
- A product may have high views but low sales → needs better description or pricing
- A product may sell fast → needs restocking and promotion
This helps you focus on winners and eliminate weak performers.
The Power of Visual Dashboards
One of the biggest advantages of modern reporting is visualization.
Instead of reading long spreadsheets, you see:
- Graphs showing sales growth
- Pie charts of customer segments
- Trend lines for performance
Visual dashboards make data easy to understand—even for non-technical users.
A quick glance can tell you:
- Whether your business is growing
- Which areas need attention
- Where opportunities exist
Real-Time vs Historical Insights
A strong reporting system gives you two types of insights:
1. Real-Time Data
- Shows what is happening right now
- Helps you react quickly
For example:
- A sudden spike in orders → increase stock
- A drop in conversions → check website issues
2. Historical Data
- Shows past performance
- Helps you identify trends
For example:
- Seasonal sales patterns
- Customer behavior over time
- Growth rate month by month
Both are important—one helps you act fast, the other helps you plan smart.
How Reporting Improves Decision-Making
Data reporting directly impacts business decisions in multiple areas.
1. Marketing Optimization
Instead of running ads blindly, you can see:
- Which campaigns bring sales
- Which channels perform best
- Cost vs return on investment
This helps you invest money where it actually works.
2. Inventory Management
Stock management becomes easier when you know:
- Which products sell quickly
- Which products stay unsold
This prevents:
- Overstocking
- Stockouts
Result: better cash flow and smoother operations.
3. Pricing Strategy
With data, you can analyze:
- Price vs sales performance
- Discount effectiveness
- Profit margins
This helps you find the perfect balance between sales volume and profitability.
4. Customer Retention
Reporting shows:
- Who your repeat customers are
- When customers stop buying
- What products they prefer
This allows you to:
- Send targeted offers
- Create loyalty programs
- Increase repeat purchases
From Data to Action: The Real Transformation
The biggest mistake businesses make is stopping at data collection.
Fast-growing stores go one step further—they act on insights.
Example:
Data shows:
- Many users add products to cart but don’t purchase
Action:
- Simplify checkout process
- Offer limited-time discounts
- Improve payment options
Another example:
Data shows:
- A specific product is trending
Action:
- Increase inventory
- Run targeted ads
- Highlight it on homepage
This is where reporting becomes powerful—it connects information to action.
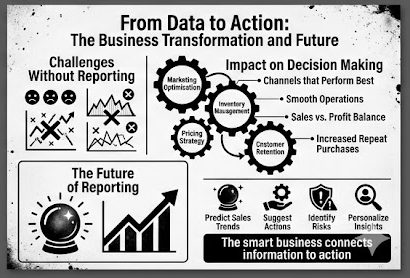
Common Challenges Without Reporting
Without a proper reporting system, businesses face:
1. Data Overload
Too much information, but no clarity.
2. Delayed Decisions
Waiting too long to understand what is happening.
3. Missed Opportunities
Not identifying trends early.
4. Poor Strategy
Making decisions based on assumptions.
What Makes a Good Reporting System?
Not all reporting systems are effective.
A good one should be:
1. Easy to Understand
Data should be simple, clear, and visual.
2. Fast and Accessible
Information should be available anytime.
3. Detailed Yet Organized
Enough depth without confusion.
4. Action-Oriented
Insights should lead to decisions.
The Future of Shopify Data Reporting
The future of e-commerce reporting is moving toward automation and intelligence.
Soon, reporting systems will:
- Predict sales trends
- Suggest actions automatically
- Identify risks before they happen
- Personalize insights for each store
This means store owners will spend less time analyzing data and more time growing their business.
Final Thoughts
A Shopify data reporting tool is not just a feature—it is a necessity for modern e-commerce.
It transforms your store from a simple selling platform into a smart, data-driven business.
Instead of asking:
- “What happened?”
You start asking:
- “Why did it happen?”
- “What should we do next?”
And that shift changes everything.
Because in today’s competitive market, the stores that grow the fastest are not the ones with the most products or the biggest budgets—they are the ones that understand their data and use it wisely.